Streaming analytics has been one of the trending topics in the software industry for some time. With the production of billions of events through various sources, analyzing these events provides the competitive advantage for any business. The process of streaming analytics can be divided into 3 main sections.
- * Collect — Collecting events from various sources
- * Analyze — Analyzing the events and deriving meaningful insights
- * Act — Take action on the results
WSO2 Stream Processor (WSO2 SP) is an intuitive approach to stream processing. It provides the necessary capabilities to process events and derive meaningful insights with its state of the art “Siddhi” stream processing runtime. The below figure showcases how WSO2 SP acts as a stream processing engine for various events.
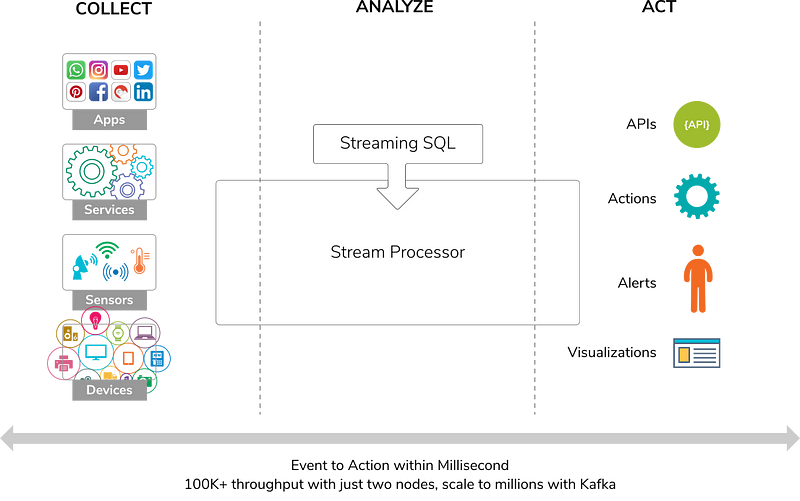
With the WSO2 SP, events generated from various sources like devices, sensors, applications and services can be received. The received events are processed in real time using the streaming SQL language “Siddhi”. Once the results are derived, those results can be published through APIs, alerts or visualizations so that business users can act on them accordingly.
Users of WSO2 SP need to understand a set of basic concepts around the product. Let’s identify the main components which a user needs to interact with.
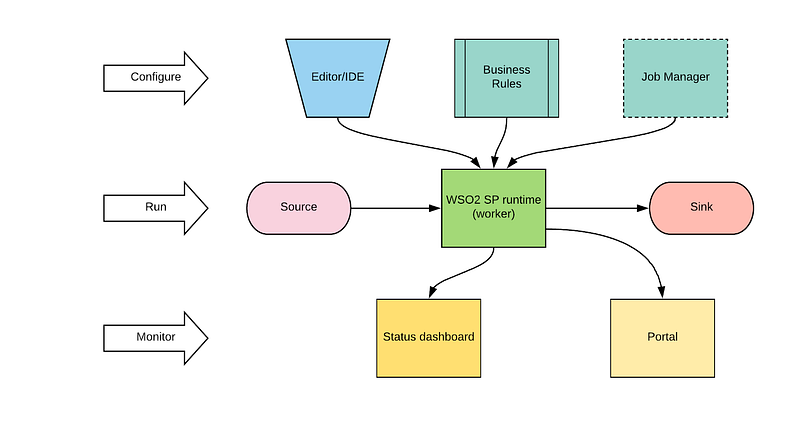
WSO2 Stream processor comes with built-in components to configure, run and monitor the product. Here are the main components.
- * WSO2 SP runtime (worker) — Executes the realtime processing logic which is implemented using Siddhi streaming SQL
- * Editor — Allows users (developers) to implement their logic using Siddhi streaming SQL and debug, deploy and run their implementations similar to an IDE
- * Business Rules — Allows business users to change the processing logic by simply modifying few values stored in a simple form
- * Job Manager — Allows to deploy and manage siddhi applications across multiple worker nodes
- * Portal — Provides ability to visualize the results generated from processing logic which was implemented
- * Status Dashboard — Monitor multiple worker nodes in a cluster and showcases the information about those nodes and the siddhi applications which are deployed
In addition to the above components, the diagram includes
- * Source — Devices, Apps, Services which generates events
- * Sink — Results of the processing logic are passed into various sinks like APIs, dashboards, notifications
With these components, users can implement plethora of use cases around streaming analytics and/or stream processing whatever you called it. The next thing you need to understand about WSO2 SP is the “Siddhi” streaming SQL language and its high level concepts. Let’s take a look at those concepts as well.
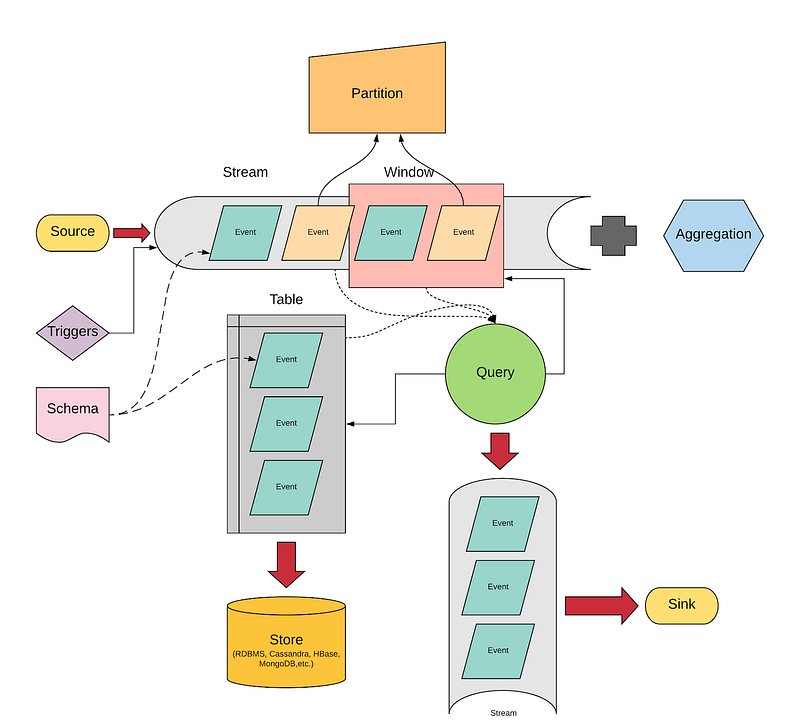
The above figure depicts the concepts which needs to be understood by WSO2 SP users. Except the source and sink which we have looked through in the previous section, all the other concepts are new. Let’s have a look at these concepts one by one.
- * Event — Actual data coming from sources which are formatted according to the schema
- * Schema — Define the format of the data which is coming with events
- * Stream — A running (continuous) set of incoming events are considered as a stream
- * Window — Is a set of events which are selected based on number of events (length) or a time period (duration)
- * Partition — Is a set of events which are selected based on a specific condition of data (e.g. events with same “name” field)
- * Table — Is a static set of events which are selected based on a defined schema and can be stored in a data store
- * Query — Is the processing logic which uses streams, tables, windows, partitions to derive meaningful data out of the incoming data events
- * Store — Is a table stored in a persistent database for later consumption through queries for further processing or to take actions (visualizations)
- * Aggregation — Is a function (pre-defined) applied on events and produce outputs for further processing or as final results
- * Triggers — Are used to inject events according to a given schema so that processing logic executes periodically through these events
Now we have a basic understanding about WSO2 SP and its main concepts. Let’s try to do a real streaming analysis using the product. Before doing that, we need to understand the main building block of WSO2 SP runtime which is a “Siddhi Application”. It is the place where users configure WSO2 SP runtime to make it happen.
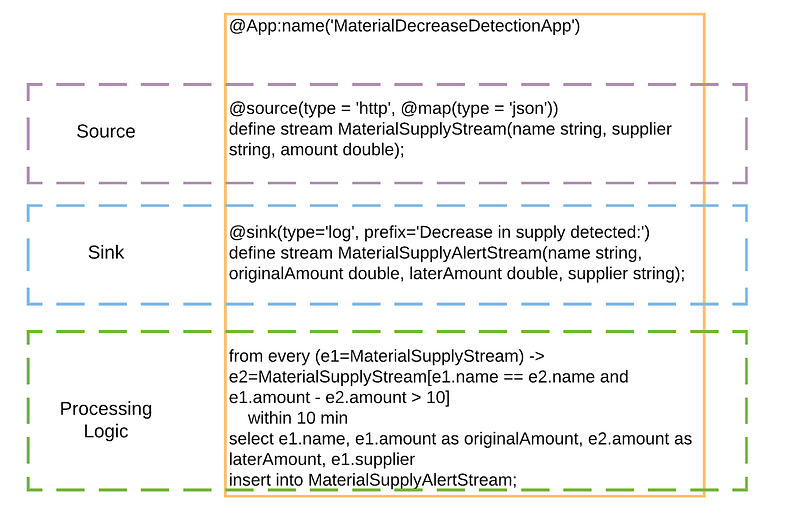
Within a Siddhi application, we have 3 main sections.
- * Source definition — This is the place to define incoming event sources and their schemas. Users can configure different transport protocols, messaging formats, etc.
- * Sink definition — This section defines the place to emit the results of the processing. Users can choose to store the events in tables, output to log files, etc.
- * Processing Logic — This section implements the actual business logic for data processing using the Siddhi streaming SQL language
Now you have a basic understanding about WSO2 SP and it’s main concepts. The next thing you can do is to make your hands dirty by trying out few examples with it. The tutorials section of the documentation is a good point to start things off.
Beginners Lab Assignments Examples
ReplyDeleteabout c++ learn